AI visibility·30 July 2026·Updated 8 September 2026·8 min read
Scraping vs API for AI visibility: why sampling wins
Ask ChatGPT how often it names your brand and the answer you get back isn't a fact, it's one roll of the dice. These models are non-deterministic, and what they pull in to answer a question changes through the day. Yet the debate everyone in this space wants to have is scraping versus API. The question that actually decides whether your number means anything barely comes up: how many times did you measure, and how honest is the little ± sitting next to the percentage you're about to email a client?
By Philipp Enders·Founder, CrunchJunkie·LinkedInBuilds the reporting and AI-visibility tooling this analysis was run with.
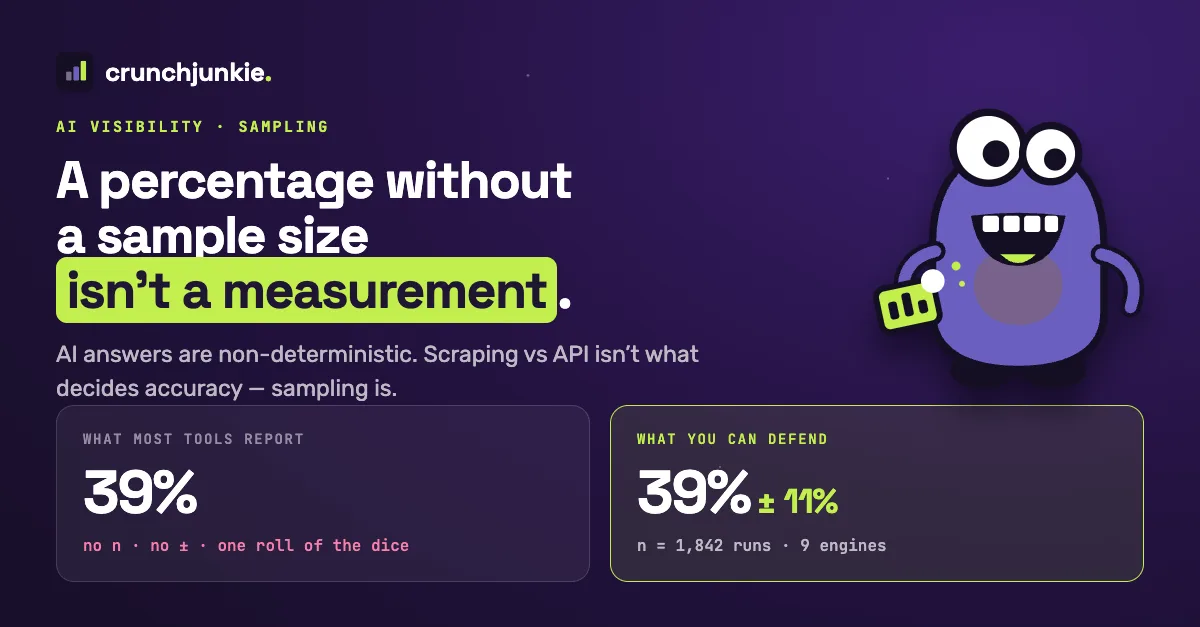
The same 39% — one reported without its sample size, one you can defend: 39% ± 11% over 1,842 runs across 9 engines.
The scraping-vs-API debate, stated fairly
There's a genuine case for capturing the consumer interface, and it deserves a fair hearing. The app people actually use and the developer API are not the same product. ChatGPT's web interface runs its own system prompt, its own memory and personalisation, its own model routing, and, most important for brand visibility, its own retrieval pipeline. Call the same model over the API and you get none of that. Perplexity is the same story: its Sonar API models don't behave like the consumer app. And for Google AI Overviews and AI Mode there is no public API at all, so reading the rendered answer is the only way in.
Where the argument overreaches is the claim that this is “exactly what users see.” It isn't. Scraping at scale means proxies and either logged-out sessions or a farm of accounts, so what you actually capture is a memoryless stranger on a datacenter IP. That's its own artificial setup, just a different one from an API call. Higher fidelity, yes. Ground truth, no.
Then there's reliability, which gets far less airtime than it should. Automated scraping of consumer chat interfaces usually breaks their terms of service, and the fallout is rarely legal. It's practical: bot detection, rate limits, and quiet data gaps every time an interface gets redesigned. An API is a contract, so it holds still. When you put a number in front of a client every month, a gap you can't explain is a real problem.
The axis that actually decides accuracy: sampling design
Here is the thing the whole category is built on and rarely says out loud: these models are non-deterministic, and retrieval drifts. Ask the same question twice and the answers can differ. Ask it again next week and the sources have moved on. Any single reading, scraped or API, is one sample from a moving target.
What does that look like in practice? Ask ChatGPT “what is the best project management tool for agencies?” three times in a row and you might show up in the first answer, vanish from the second, and reappear in the third. Same brand, same afternoon, and you have just scored 100%, then 0%, then 100%. Measure once and you have recorded a coin flip. A number you can trust only appears once you have asked many times.
So the real question is not how you captured the answer. It is how you sampled. Four things matter:
1. Runs per prompt. How many times is each prompt asked, on each engine, in each scan? A brand that turns up in one of two runs is not “50% visible” in any useful sense. It is a coin toss. The uncertainty around a proportion only shrinks as you add samples (Brown, Cai & DasGupta, 2001).
2. Cadence. How often does the tool re-measure, and can you run it daily when a launch or a news story is actively moving the answer?
3. Locale. AI answers depend on market and language. Your visibility for “best CRM for agencies” asked from Germany in German is simply a different number from the same prompt asked from the US in English.
4. Reported uncertainty. Does the number come with a sample size and a margin of error, or is it a bare percentage that quietly hides how shaky it is?
There is also a cost twist that settles the argument in the background. Running a browser costs something like ten times more per query than an API call, so scraping-first tools tend to run short on samples. They pay for the fidelity with frequency and coverage. A tool that scrapes each prompt once a week gives you a worse trend than one that hits the same prompt dozens of times a week, whatever the capture method. For something like share of voice, more samples beats a prettier single sample nearly every time.
Since first publishing this, the retrieval drift stopped being something we infer: several engines expose the literal web searches they run before answering, and we capture them verbatim. The same prompt fans out into different searches on different runs — you can watch the moving target move. We published what those fan-out queries actually look like; as evidence for the sampling argument, it is about as direct as this field gets.
One number, and the distribution it hides
A single AI-visibility percentage can mislead in two ways, and neither is fixed by scraping harder. Both are fixed with honest statistics.
Start with the extremes. The textbook standard error, the square root of p(1−p)/n, falls apart near 0% and 100% and whenever n is small. Say an engine mentioned you in zero of eight runs. The formula reports 0% ± 0%, a flat declaration that you are never mentioned. Eight tries prove nothing of the sort. If your true rate were one in ten, drawing a zero across eight runs is completely ordinary. The Wilson score interval is honest about it. It still reports 0%, but it flags that the real rate could sit as high as roughly 11%, and it never claims an impossible visibility below 0% or above 100%. That matters, because thin near-zero slices are exactly where per-engine numbers live.
The second problem is subtler, so here it is without the jargon. Picture a poll bragging about 1,000 responses. Then you find out they came from 10 households of 100 people, and everyone in a household votes the same way. You do not have 1,000 opinions. You have 10. Report the margin as if all 1,000 were independent and the poll looks far sharper than it really is.
AI engines are those households. Ask one engine the same prompt many times and its answers mostly agree with each other. A grounded model that likes you keeps naming you; an ungrounded one keeps skipping you. So nine engines times a few hundred runs is not a few thousand independent measurements. It is more like nine strong opinions, each asked over and over. Here is what that does to a real number. Say a brand pools to about 39% visibility across nine engines, and those engines run the range from barely mentioning it to naming it most of the time. Treat every run as independent and you would report a tidy ± 3%. Account for how much the engines disagree (a design effect, in survey-sampling terms) and the honest margin is closer to ± 11%. Same 39%, wildly different confidence.
That is the whole point. Two brands can show the identical headline percentage and deserve completely different levels of trust, and a decent tool tells you which is which. It is the gap between a number that looks reassuring and one you can actually defend when a client pushes back.
How CrunchJunkie approaches it
All of that shaped how we built CrunchJunkie.
We capture in a hybrid way, on purpose. When a consumer surface has no API, which is the case for Google AI Overviews, Google AI Mode and Microsoft Copilot, we read the real answer a searcher would see. Everywhere else — seven providers, OpenAI through Meta AI — we go through the providers' own web-grounded APIs. Going API-first is not us cutting corners. It is the cheap-per-query route, and cheap per query is exactly what lets us sample more often, which is where accuracy comes from.
Every number carries its receipts. You will not find a bare percentage anywhere in CrunchJunkie. Each figure shows its sample size (“n = … runs”) and a margin of error that stays inside 0–100% and grows wider when your engines disagree or the sample is thin. A shaky number looks shaky, whether you are in the app, in a report, or on a shared link.
We also pool the maths correctly: mentions over runs across the whole set, divided once, never an average of averages that quietly inflates a few small, lucky slices.
We do not publish our exact run counts or the guts of our interval maths. The principles are what matter, and you should hold every vendor to them, us included.
CrunchJunkie vs Peec AI: shop on the sampling questions
The useful way to compare AI-visibility tools has nothing to do with scraping. Ask four questions and make every vendor answer them, Peec AI and us included:
1. How many times do you run each prompt, per engine, per scan? One run is a coin flip; a trend needs repeats.
2. How often can I scan, and do I get daily on my plan?
3. Do you measure per market and per language?
4. Do you show a sample size and a margin of error, and does that margin widen when the sample is thin or the engines disagree?
We answer yes to all four, on every plan, across ten engines, with the margin of error sitting right next to every number. That is the comparison we want. Whose number still holds up a month later tells you a lot more than whose capture method sounds impressive. A confident percentage with no sample size and no ± is just confidence you are being asked to take on trust.
The bottom line
None of this makes scraping wrong or API sampling a shortcut. They each measure a slightly different, slightly artificial slice of reality. What decides whether your month-over-month move is real or just noise is the sampling: enough runs, often enough, in the right language, with the uncertainty shown plainly. So ask for those numbers. The tool worth paying for is the one that can give them to you.
Frequently asked questions
Neither on its own. Capturing the interface is more faithful to what a consumer sees and is the only option for surfaces with no API, such as Google AI Overviews and AI Mode. API sampling is cheaper per query, which allows more runs and higher cadence. Accuracy is decided by how many times you sample and how honestly you report uncertainty, not by capture method alone. The best approach is hybrid.
More than once — a single answer from a non-deterministic model is a coin flip. The right number trades off against cost, but the essential thing is that the tool repeats each prompt per engine and shows the sample size behind every figure so you can judge how reliable it is.
It's the ± range around a percentage that reflects how much the number would move if you re-ran the scans. A good one is boundary-safe (it never implies below 0% or above 100%) and widens when the sample is small or the engines disagree with each other. A bare percentage with no ± hides how uncertain it is.
No. CrunchJunkie tracks chat assistants through the providers' own web-grounded APIs, and captures the rendered consumer answer only for surfaces that have no API at all — Google AI Overviews, Google AI Mode and Microsoft Copilot. Every result carries its sample size and margin of error.
See your AI visibility on your own brand
Reporting and AI search visibility in one console — run your first report and scan inside the 14-day free trial.