AI visibility·3 August 2026·Updated 8 September 2026·11 min read
AI Visibility Metrics: The 12 That Matter (and 5 That Lie)
AI search visibility metrics measure how often, how prominently and how favourably a brand appears inside AI-generated answers. The core set is visibility rate, share of voice, average position, citation share, sentiment and prompt coverage — measured per engine, across repeated runs, over a rolling window of at least two weeks. Anything measured once is noise. What follows is the set we would actually defend in a client meeting, built from 30 days of running [CrunchJunkie](/products/ai-visibility) on our own agency across nine engines.
By Philipp Enders·Founder, CrunchJunkie·LinkedInBuilds the reporting and AI-visibility tooling this analysis was run with.
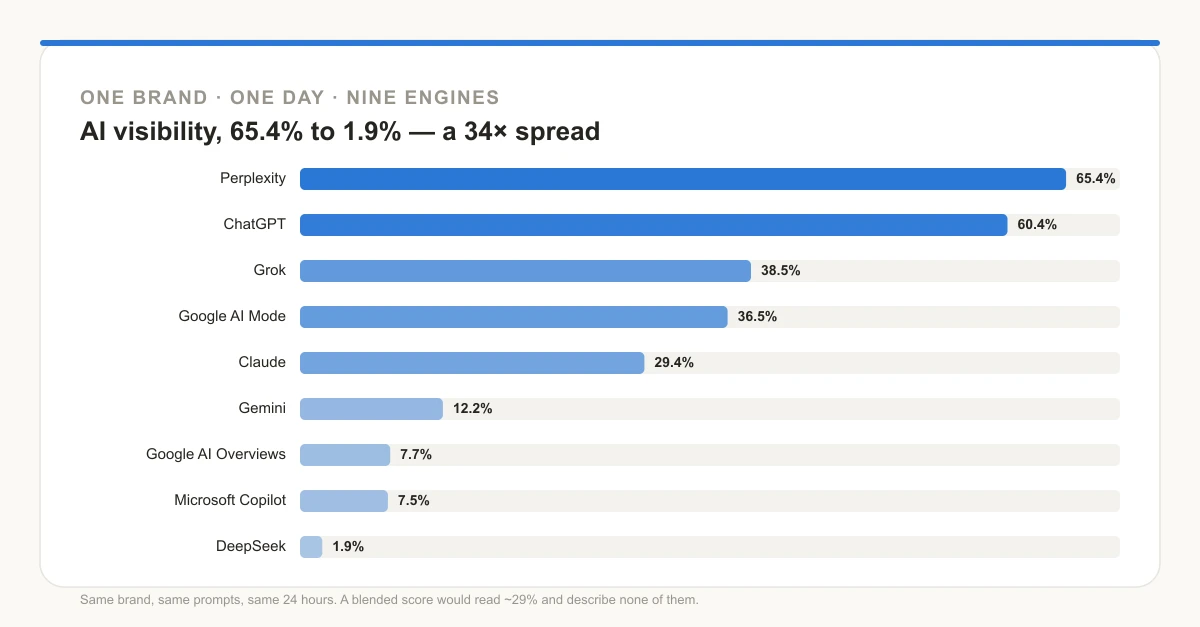
One brand measured across nine engines on the same day. A blended 'AI visibility score' would read about 29% and describe none of them.
One number, nine engines: a 34× spread
On 3 August 2026 we measured one of our own brands — Pmax Online, our Spanish agency — across nine AI engines using an identical prompt set on the same day. Its visibility rate ranged from 65.4% on Perplexity to 1.9% on DeepSeek. Same brand, same questions, same twenty-four hours — a 34× spread.
Any dashboard that blends those into one "AI Visibility Score" has destroyed the only information in the data. A blended average here reads about 29% — a number that describes none of the nine engines and points at no action at all. The per-engine view says something specific: this brand owns Perplexity and ChatGPT, is competitive on Grok and Google AI Mode, and is effectively absent from Google AI Overviews, Copilot and DeepSeek. Those are three different strategies, not one.
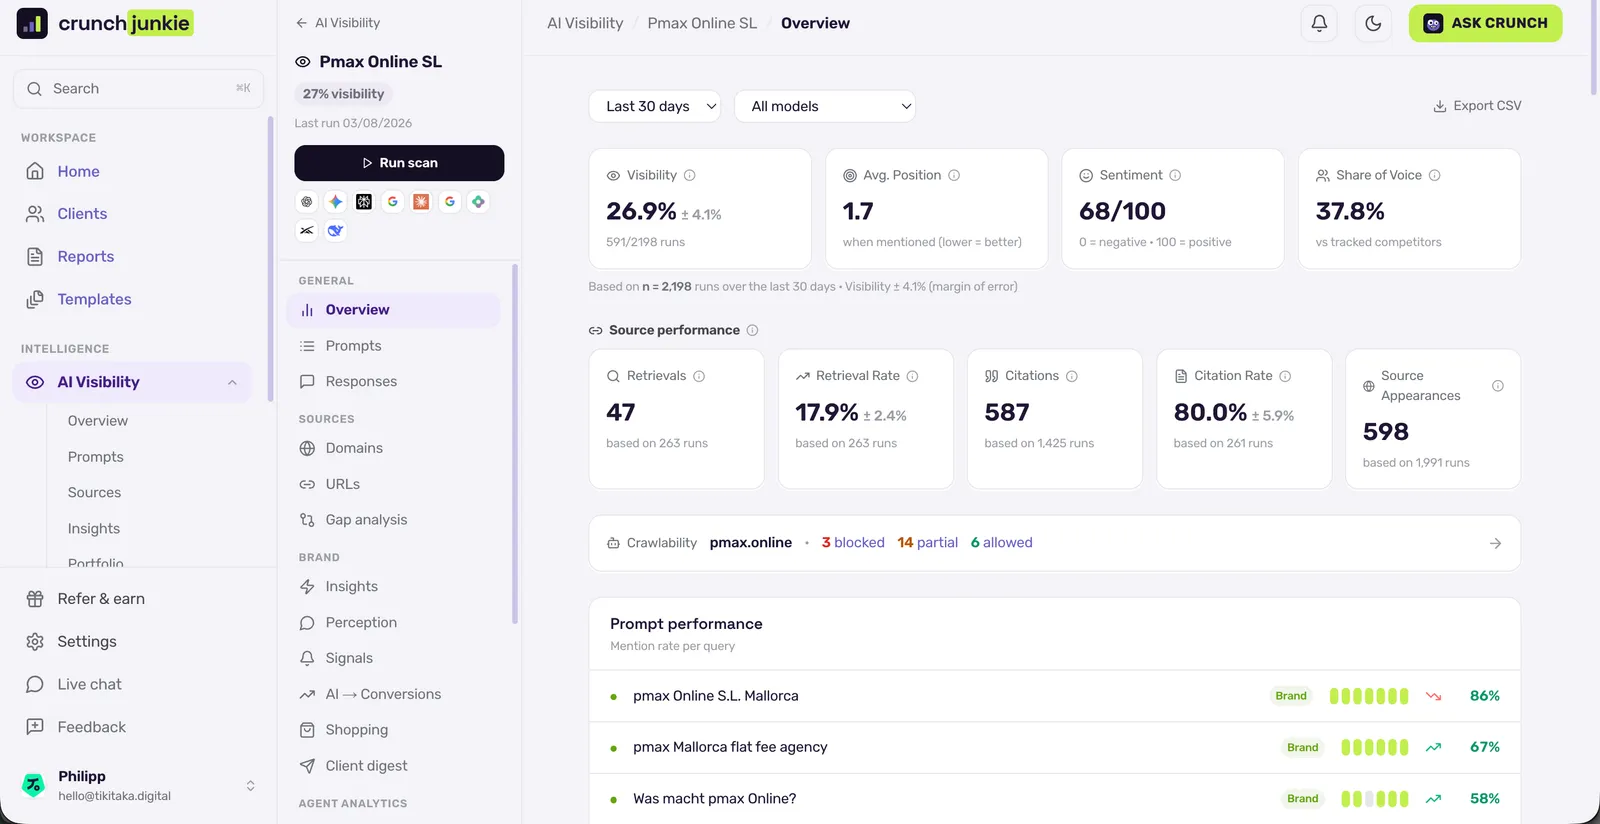
Our own overview leads with a blended rate too — but with its ± margin of error and sample size (n = 2,198) shown, and the per-engine breakdown one dropdown away. A blend is a fine headline; it just can't be the whole report.
Engine
Visibility
Runs
Avg. position
Sentiment
Perplexity (Sonar Pro)
65.4%
34/52
1.8
70
ChatGPT (GPT-5.6)
60.4%
32/53
2.1
70
Grok (4.5)
38.5%
20/52
1.6
78
Google AI Mode
36.5%
19/52
1.8
64
Claude (Sonnet 4.6)
29.4%
15/51
1.3
81
Gemini (3.5 Flash)
12.2%
5/41
1.0
60
Google AI Overviews
7.7%
4/52
2.0
50
Microsoft Copilot
7.5%
4/53
—
50
DeepSeek (V4 Flash)
1.9%
1/52
—
75
Why AI visibility isn't rank tracking
Traditional SEO gives you a semi-deterministic spectrum: you move from position 7 to position 4. Generative engines don't work that way. Researchers at the University of St. Gallen describe an inclusion–exclusion dynamic — you're in the answer, or you've vanished entirely, with little in between (Schulte, Bleeker & Kaufmann, "Don't Measure Once: Measuring Visibility in AI Search", arXiv:2604.07585, April 2026).
Their findings are the most important thing published on this topic, and most dashboards ignore them. Read the third row of the table below twice: when the same prompt is fired at the same engine minutes apart, the cited sources overlap by roughly a third. That variance isn't the algorithm changing — it's the model being probabilistic. A screenshot of ChatGPT naming your competitor is not a finding; it's a coin flip you photographed.
Every KPI below assumes aggregation across repeated runs. If your tool checks once a day, or once per prompt, its numbers are decoration.
What they measured
Result
Day-to-day overlap in cited sources (Jaccard)
0.34–0.42 — about 65% of sources change overnight
Day-to-day overlap in brands mentioned
0.45–0.59
Same prompt, re-run the same day (source overlap)
0.32–0.43
Standard error of a single-run estimate
0.370
Runs needed per prompt/day for SE < 0.10 (brand)
7
Runs needed for source-level coverage
8
Rolling window for SE < 0.05
24 days
Tier 1 — Presence: are you in the answer at all?
Visibility rate (mentioned runs ÷ total runs, per engine) is the foundational KPI, and the nine-engine table above is what "reported properly" looks like: a percentage, its denominator, and the engine it belongs to. Most B2B brands appear in under 10% of their relevant prompts; above 20% across a buyer-intent set is strong. The failure mode is blending engines into one score, or showing a percentage without its run count.
Share of voice (your mentions ÷ all tracked brands' mentions, in the same answer set) is the most misread number on this list. Same brand, same day: on DeepSeek it recorded a 100% share of voice off a 1.9% visibility rate — one mention in 52 runs, in a category where that engine named no one else at all. "100% share of voice" there is arithmetically correct and completely false. Share of voice measures who gets named when anyone gets named; if almost nobody does, it measures nothing. Never show it without the visibility rate and run count beside it.
Average position — where you land when you land — moves independently of presence. A good tool reports null when a brand appears in prose with no extractable rank (that's why Copilot and DeepSeek show no position above); a bad one imputes a number. The same brand has its lowest presence on Claude (29.4%) but its best average position anywhere (1.3): named rarely, and named first.
Prompt coverage (prompts with at least one mention ÷ prompts tracked) is breadth to visibility rate's depth. A brand at 30% concentrated in three prompts is far more fragile than one at 15% spread across twenty. A one- or two-prompt setup measures the quirks of those prompts, not your brand.
Tier 2 — Sourcing: where the answer came from
This tier is where AI visibility stops resembling SEO and starts resembling PR. Citation share is which domains the engines actually cite when answering your prompts — the supply side, because you can't be mentioned if the pages being read don't mention you. Across 1,991 runs in 30 days, the engines cited 1,256 distinct domains.
Three observations worth more than most GEO checklists. First, two of the top three cited domains here are ours — our own site and our German agency, tikitaka.digital — with our strongest competitor, rex4media.com, sitting between them. When an engine answers "best agency in X" it reads their pages and ours, then decides: a competitor's content is part of your measurement environment, and yours is part of theirs. Second, directories and profiles do disproportionate work — a single regional directory page was cited 106 times, a German-language "best agency on the island" guide 89 times, our LinkedIn company page 66, our Clutch profile 36, and, unexpectedly, our entry in the Spanish company register at einforma.com 46 times. Nobody's GEO checklist says "check your business-registry listing"; the data says it's being read. Third, own-domain dominance is both the goal and a risk: a large share of your visibility then rests on pages you control, and engines discount self-referential sourcing on explicitly comparative queries.
Two refinements matter. A domain pulled during retrieval and a domain cited in the answer are different things, and merging them inflates your numbers — in our window 1,427 of 1,991 runs carried the split, and the gaps are informative (one marketplace showed 140 cited against 52 retrieved; a competitor 83 cited and zero retrieved). And source concentration is high: the St. Gallen study found a mean Gini of 0.715 across engines, so on some engines a handful of domains own the category and your realistic route in is being cited by them, not outranking them.
Domain
Cited runs
What it is
pmax.online
587
Our own site
rex4media.com
336
Competitor
tikitaka.digital
199
Our German agency (Tiki-Taka Media)
support.google.com
179
Vendor documentation
mallorca.com
155
Regional directory
youtube.com
150
UGC
reddit.com
144
UGC
sortlist.com
140
Agency marketplace
Tier 3 — Quality: what the answer says about you
Sentiment is scored per mention and aggregated per engine, and the competitive read matters more than the absolute number. On Claude on 3 August, the strongest competitor in our set scored 35.3% visibility at 94 sentiment, against our 29.4% at 81 — named more often and described more warmly. Visibility alone showed a four-point gap; sentiment showed the real one.
Recommendation (win) rate is for shopping and commerce prompts: of the runs where the AI recommended any tracked product, what share included yours? It should stay null until there is at least one decisive run — a 0% win rate over two runs means nothing.
Answer accuracy is underrated and rising fast. When the AI describes your pricing, services or locations, is it right? A confidently wrong answer at 40% visibility is worse than absence; track factual error rate on brand prompts separately, because it is the one that becomes a support ticket.
Tier 4 — Outcome: did any of it matter?
AI referral visitors convert well, but the published 2026 numbers disagree by an order of magnitude — from roughly 4.4× organic (Semrush's cross-industry figure) to 23× in Ahrefs' analysis of its own traffic, where AI search drove 0.5% of visits but 12.1% of signups; Adobe Analytics found AI-referred retail traffic converting 42% better in March 2026, after converting 38% worse a year earlier. Most are vendor-reported and volumes are small — use the direction, not the multiple.
Two first-party signals are worth adding. Since 3 June 2026, Google Search Console has a dedicated generative-AI performance view for AI Overviews, AI Mode and Discover — the first first-party impression data for AI surfaces, though it is impressions only, split by page, country, device and date, with no clicks or query data, and Google surfaces only. And your GEO readiness score — a technical audit of crawler access, server-side rendering, structured data and llms.txt — is a leading indicator, not an outcome. Exhibit B shows how leading.
The five metrics that lie
1. Raw mention count. Ninety mentions means nothing without the denominator — ninety of a hundred runs is dominance, ninety of nine hundred is a rounding error. Always publish the ratio and the run count together.
2. Share of voice without visibility. Covered above: 100% share of voice off a 1.9% visibility rate. Never show share of voice without visibility rate and run count beside it.
3. Any single-run observation. Single-run standard error is 0.370 — a true 50% visibility rate can present as anything from 0% to 100%. It's still how most "AI visibility audits" are sold.
4. Composite "AI visibility scores." Vendor black boxes blending presence, sentiment and position into one number: unfalsifiable, incomparable across tools, and they conceal exactly the engine-level variance that motivated the measurement.
5. Sentiment or position off a tiny n. In our 3 August data one competitor recorded a perfect 100 sentiment and an average position of 1.0 — mentioned once, in 51 runs. Quality metrics need a floor; we don't report sentiment below five mentions, and neither should you.
Exhibit A — leading isn't stable
The brand in the table above is the most-cited domain in its own category and leads on two major engines. It still loses Google AI Mode and Claude to a smaller competitor, sits under 8% on three engines, and moved on Perplexity from 15.8% (7 July) to 70.0% (27 July) to 65.4% (3 August). Leading is not the same as stable — and neither is visible on a single day's screenshot.
Exhibit B — a 97/100 that still gives engines nothing to quote
A technical GEO audit we ran on 29 July returned a composite of 97/100, band AI-ready: all 15 live-answer crawlers allowed, content server-rendered and readable without JavaScript, valid llms.txt, agent readiness 100/100. On every checklist circulating in this industry, that's a finished job.
The audit disagreed. It flagged three high-priority content gaps on the same site: no authoritative outbound citations, direct quotations on one of six sampled pages, cited statistics missing from two of six. Those map precisely onto the strongest signals in the foundational research — Aggarwal et al. ("GEO: Generative Engine Optimization", KDD 2024) tested roughly 10,000 queries and found statistics, quotations and source citations lifted visibility by up to 40%, while classical keyword density barely moved citation probability.
This is the gap most GEO work falls into. Crawler access makes you eligible; quotable material makes you cited. A site can be technically immaculate and still give an answer engine nothing worth lifting — and the citation data above shows what fills the vacuum instead: directories, marketplace profiles, third-party guides and your competitors' own pages.
During development of the tool, we ran it on our own agency first — and that's where the product's core decision came from. A single AI-visibility number told us almost nothing. The day we split it by engine it fell apart in the most useful way: we were winning Perplexity and ChatGPT and almost invisible on three other engines. One number had been hiding four different jobs — so we built CrunchJunkie to never report just one.
— Philipp Enders, Founder, CrunchJunkie
What actually goes on the dashboard
For a monthly client report: six numbers and two lists. Beyond the table below, add the top 10 cited domains — that's your outreach list, and as the data above shows it will include directories, profiles and registries you'd never have prioritised — and the content gaps: prompts where competitors are named in every recent answer and you're named in none. That second list is the closest thing AI visibility has to a keyword-gap report, and it's where the work starts.
Cadence: at least 7 runs per prompt per day, a prompt portfolio in the dozens rather than the handful, and a two-to-four-week rolling window before anyone draws a conclusion. Report month over month, never day over day. CrunchJunkie puts these AI metrics and the GA4 numbers in the same white-label report, so the question a client actually asks — is this working — can be answered on one page.
KPI
Cut by
Guardrail
Visibility rate
Engine
Always with run count
Share of voice
Engine
Never without visibility rate
Prompt coverage
Prompt category (discovery / brand / competitor)
Segment brand prompts out
Citation share
Domain
Split cited vs. retrieved
Sentiment
Engine
Null-safe; suppress below 5 mentions
AI referral conversions
Source
Directional only
What changed since publication (September 2026)
Three additions to the measurement stack since these figures were taken, kept here because this page is meant to stay the reference rather than accrete sequels. The roster is now ten engines — Meta AI joined as the tenth, web-search-grounded like most of the others — so current dashboards show one engine more than the July tables above. The retrieval side became directly observable: several engines expose the literal web searches they run before answering, and capturing those fan-out queries verbatim turns "which sources feed the answer" from inference into a table. And the supply-side metrics grew a blunt new instrument: reading server logs for AI-crawler blocks, where our first fourteen-day study found 11.6% of AI fetches bouncing off a firewall on a site whose robots.txt allowed all of them. None of this changes the July numbers or the argument; it changes what a complete dashboard shows.
Frequently asked questions
Visibility rate — mentioned runs divided by total runs, reported per engine with the run count attached. Every other metric interprets it. Blending engines into a single score throws away the only actionable signal: in our own data one brand ranged from 65.4% on Perplexity to 1.9% on DeepSeek on the same day.
Your brand's mentions divided by all tracked brands' mentions in the same set of AI answers. It's relative and meaningless without the underlying visibility rate: in our own data one engine produced a 100% share of voice off a 1.9% visibility rate, because it named no other brand at all. Always show share of voice next to the visibility rate and the run count.
At least seven runs per prompt per day for brand-level visibility, eight when cited sources matter. Below that, standard error exceeds 0.10. A single run has a standard error of 0.370 — effectively uninformative (Schulte, Bleeker & Kaufmann, University of St. Gallen, 2026).
Partially, since June 2026. Search Console's generative-AI performance reports show impressions from AI Overviews, AI Mode and Discover, by page, country, device and date. There is no click, CTR or query data yet, and it covers Google surfaces only — nothing from ChatGPT, Claude or Perplexity.
Different retrieval stacks, different index freshness, and different willingness to search the web at all. In our data one brand scored 65.4% on Perplexity and 1.9% on DeepSeek — same prompts, same day. This is exactly why a single blended score misleads: it averages away the one thing you can act on.
In our own category over 30 days: our own domain first, then our strongest competitor and our own German agency, then vendor documentation, a regional directory, YouTube, Reddit and an agency marketplace. Directories, profiles and even a company-register entry carried more weight than most marketing blogs — so the citation report doubles as an outreach list.